EGW consistently seeks to remind readers that metrics that refer to “single points in time”– scalar numbers– are important in taking the temperature of the energy industries, but alone they are misleading. Knowing how that “temperature” changes over time is a more useful and insightful type of number, and more predictive of the near term possibilities in both renewable and carbon-based energy markets. The vector numbers include “magnitude and rate of change” of improvements in the economics of renewables, and while exponential curves aren’t technically a vector (they show better than linear growth), the news out of the solar sector is pretty compelling rate-of-change.
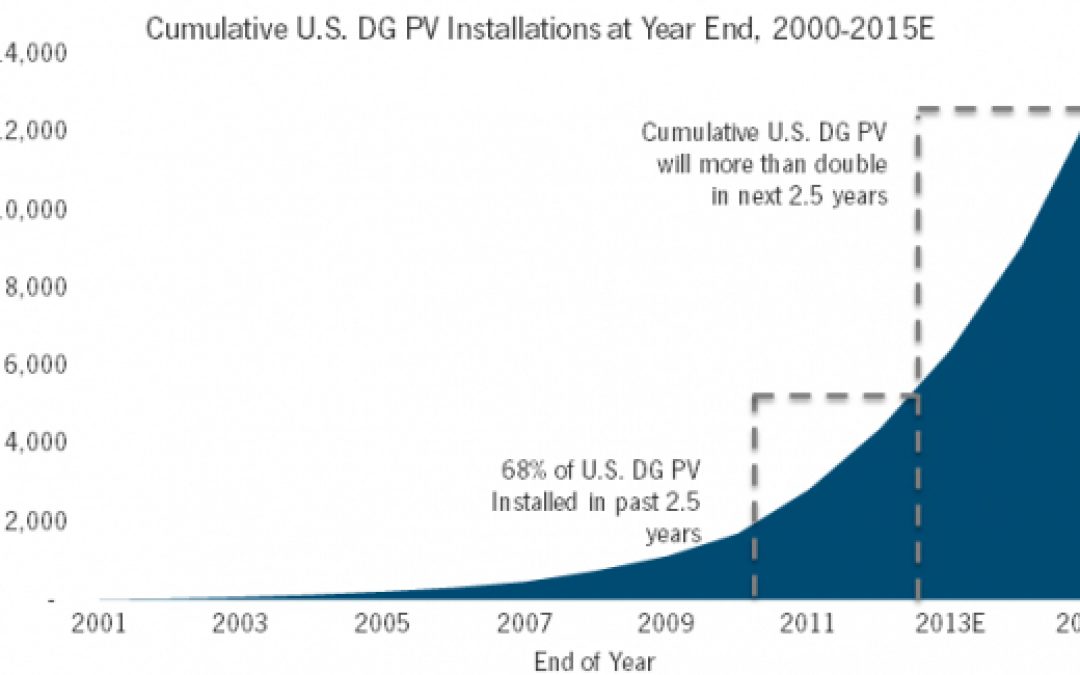
GreenTechSolar recently reported that 2/3 of all solar PV on the planet was installed in the last two years– since January 2011.

Stop and ponder that for a moment.
It took nearly four decades to install 50 gigawatts of solar PV, and in the last two and a half years it doubled to 100 gigawatts, while global module prices have fallen over 60%. Perhaps more importantly, that number of installed capacity is set to DOUBLE AGAIN in the next two and a half years. In the US that number is expected to be a jump of 200% up by 2015.
We are well on our way to outstripping the need for subsidies, and these accelerating rates, while indicating inevitable disruption in the solar industry itself typical of rapidly expanding markets, are just the kinds of curves we want to see for economies of scale to kick in, encouragement for accelerated innovation, and ample justification for the investments made in subsidizing solar to-date.
LEARN MORE
Learn more about energywhiz.
Follow us, http://Twitter.com/NobleProfit
Like us, http://Facebook.com/NobleProfit
Register at http://NobleProfit.com to gain valuable insights in related topics.
Noble Profit is brought to you by http://CreativeEntity.Org
Creative Entity Productions http://Creative-Entity.com
Created by Amy Seidman
 Noble Profit™ is an authentic source for discovering innovation, trends and investment in clean tech, and sustainable business.